
Candlestick formations are a technical analysis tool that can help predict future price movements. They are used to identify patterns in the price movements of security and can be used to make trading decisions. This blog post will discuss what to do when reversal candlestick patterns appear. We will go over the three most common types of reversal candles: the hammer, inverted hammer, and shooting star.
What To Do When Reversal Candle Formations Appear
When a reversal candle formation appears, it is often an indication that the current trend will reverse. This means that you may want to consider taking some of your positions off the table or even reversing your position if you are already in a short trade. Some traders also like to use reversal candles as a signal to enter into a new trade. For example, if you are looking to get into a new long trade, you may want to wait for a bullish reversal candle to form before taking the trade.
Reversal candles can be very useful in helping you to identify reversals in the market. However, it is essential to remember that they are not always 100% accurate, so you should always use other forms of analysis along with them to get a complete picture.
If you want to succeed in trading, you must learn how to interpret reversal candles and use them to your advantage correctly. By doing so, you can potentially improve your trading results and make more money in the markets.
Three Most Common Types Of Reversal Candles
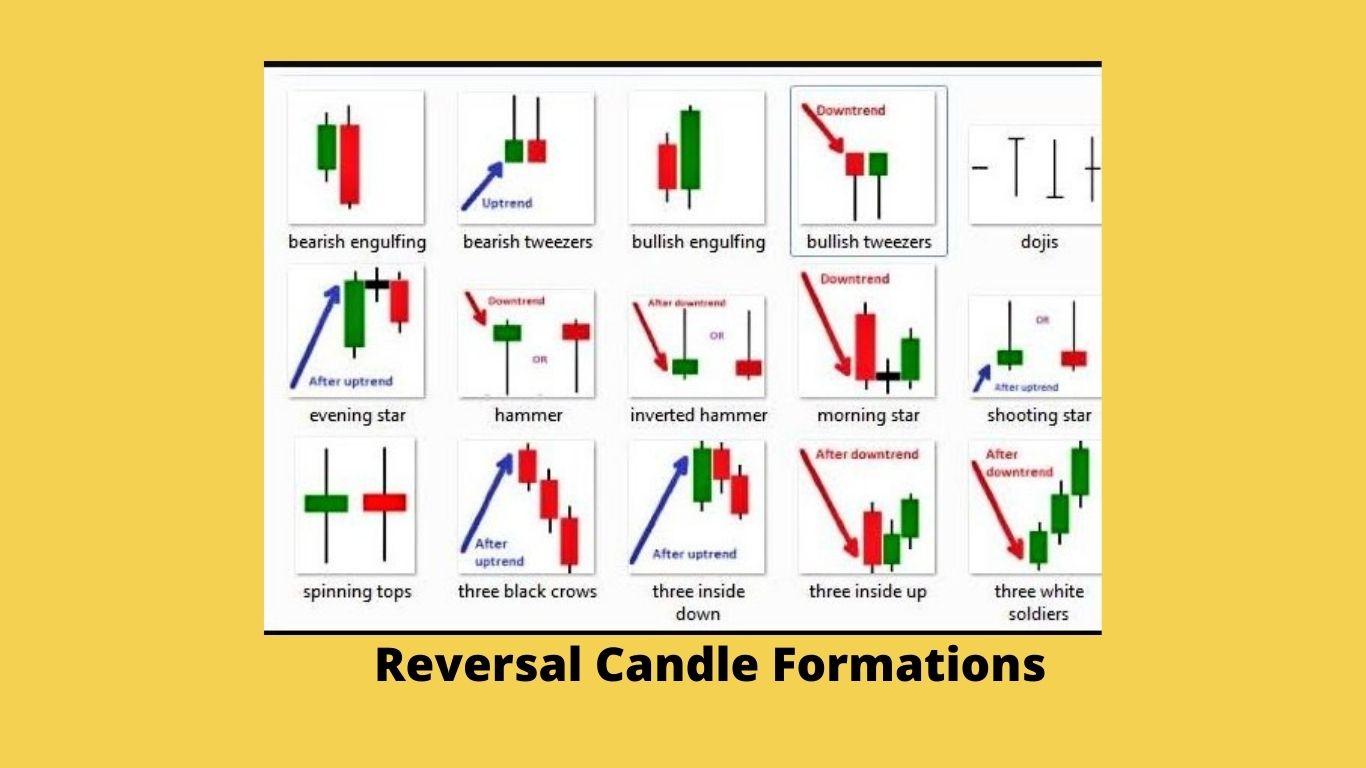
There are three types of reversal candles that traders should be aware of. These are the hammer, inverted hammer, and shooting star.
The Hammer
The hammer is the most common of all the reversal candlestick patterns, and it is typically seen near the end of a downtrend. This formation is characterized by a small body and a long tail, indicating heavy selling pressure during the trading session. The hammer is a bullish reversal pattern that forms when a stock falls lower than its opening price but then rallies to close above its opening price. This signals that buyers have taken control of the market and are pushing the stock higher. When the hammer appears, it is often a sign that the bears are losing control of the market and imminent reversal.
The key to trading this pattern is to wait for confirmation before entering into a trade. This can be done by looking for a bullish engulfing pattern or a breakout above the previous high. If the stock fails to break above the previous high, it could signal that the bulls are losing control and a reversal could occur.
The Inverted Hammer
The inverted hammer is a bearish reversal pattern that forms when a stock rises higher than its opening price but then falls to close below its opening price. This signals that sellers have taken control of the market and are pushing the stock lower. This formation is characterized by a small body and a short tail, indicating heavy buying pressure during the trading session. When the inverted hammer appears, it is often a sign that the bulls are losing control of the market and that a reversal could be imminent.
When the inverted hammer appears, it is often a sign that the bulls are losing control of the market and that a reversal could be imminent. Traders should watch for confirmation of this reversal candle formation before entering into any short trades. One method of confirming an inverted hammer is to wait for a subsequent day when the stock opens below its previous day’s low. This proves that the selloff continues and that traders should look to short the stock.
Traders should always use caution when trading based on any single pattern and confirm the signals with other indicators before entering into any trades.
The Shooting Star
The shooting star is another common reversal candle formation, and it is typically seen near the end of an uptrend. This formation is characterized by a large body and a small tail, which indicates that there was little buying or selling pressure during the trading session. When the shooting star appears, it is often a sign that the bulls are starting to run out of steam and that a reversal could be imminent.
It is crucial to confirm the reversal with all candle formations by looking at other indicators and technical analysis techniques. Inverted hammer and shooting star patterns can generate trading signals, but they should not be relied on exclusively. Always remember to use risk management techniques when trading any security.
Conclusion
By understanding how to trade these reversal candlestick patterns, you can make more informed decisions about your investments!
While trading these formations can be profitable, there is always risk involved in any investment. Always remember to do your research before trading any financial instrument!
Thank you for reading!


