
When you first start learning about cryptocurrency, you will likely be bombarded with new, confusing terms. Some are self-explanatory, but others are puzzling. What is a doji? You might be wondering if you are new to the world of cryptocurrency. Then again, it’s not an everyday term, so even seasoned traders might need a refresher. The doji is something many investors study and use to make decisions, so it’s worth learning about.
History of the Term Doji
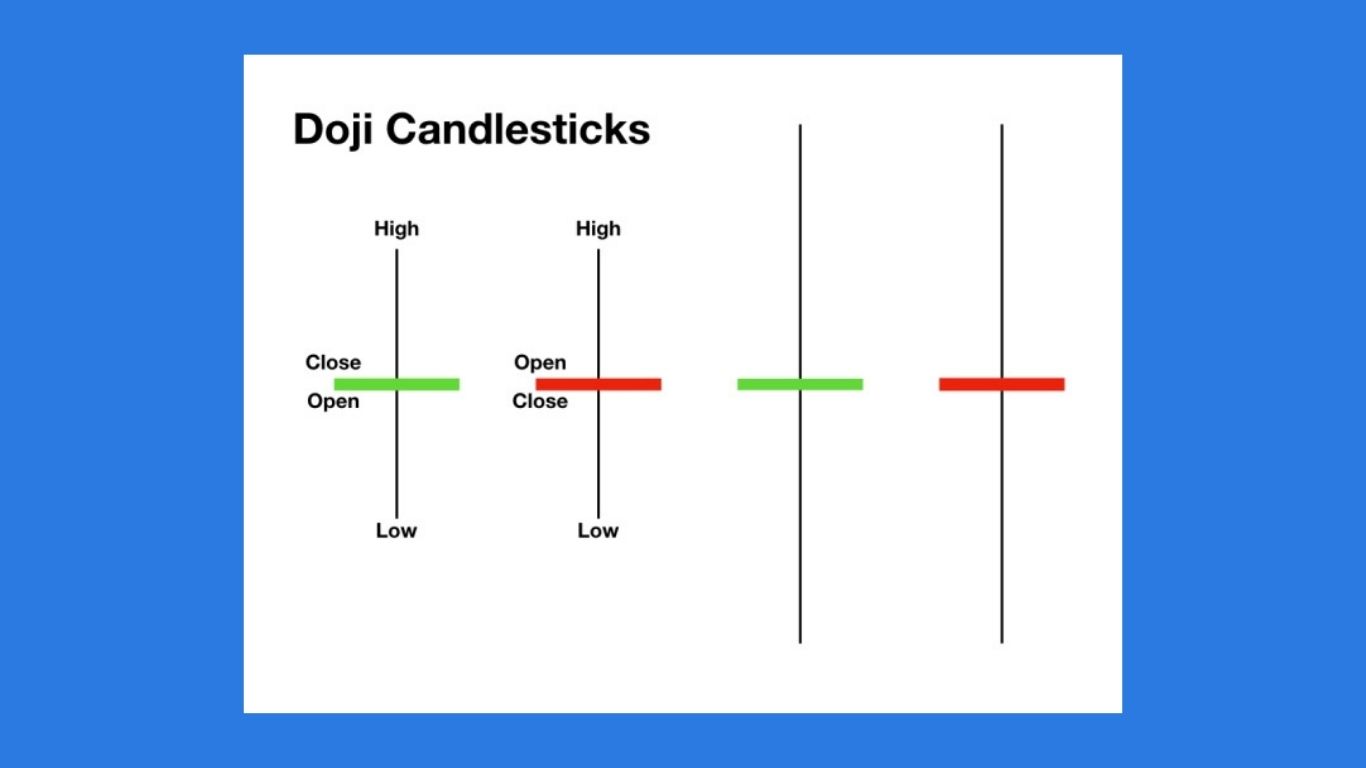
The doji is a pattern seen on candlestick charts. Candlestick charts are a type of financial chart designed to show the price movements of currencies, stocks, or other assets. When a doji appears, it indicates that the open and close prices are the same or very similar. Thus, the doji candlestick pattern can indicate indecision.
You may have noticed that the word “doji” sounds Japanese in origin. That is correct. Actually, this is a very old term that was created by a Japanese rice trader named Honma in the 18th century. He wanted a way to track the price of rice. This word would only be brought to the Western world in the 1990s. It translates to “blunder” or “mistake.” So, the doji can be a somewhat ominous pattern.
While the term was created to measure rice prices, today it is often used by investors to study the price movements of stocks and cryptocurrencies. Indeed, the doji is such a useful concept that you will probably be hearing about it whether you are interested in Bitcoin, Ethereum, or any other altcoins.
How Variations of the Doji Are Named
There are actually many different types of doji patterns, with each different depending on the circumstances. They are named based on their appearance on the candlestick chart.
When most people are talking about a doji pattern, they are referring to the so-called neutral doji. It is shaped like a cross with all the lines being of equal length. It is the most basic type.
If there is a huge amount of indecision, people will speak of a “long-legged doji” instead. It is shaped like a cross, with the vertical lines being much longer than the horizontal ones.
There is a specific type of long-legged doji which is called a “rickshaw man doji.” This variation appears when the high and low prices are very far apart. It is named after the men who pull rickshaws, a type of cart used for transportation in certain countries.
It should be noted that not all of these terms are standardized. So, while the rickshaw man doji is usually said to be a type of long-legged doji, some people disagree. Some say the rickshaw man doji should be considered its own thing that is just similar to a long-legged doji. There are also others who use the term long-legged and rickshaw to mean the same exact thing. So, it’s always a good idea to ask for clarification when someone is using any of these terms.
Other doji candlestick patterns are also named by their appearance on the chart. If the doji’s horizontal lines are at the very bottom, this is called a gravestone or tombstone doji. This is because it resembles a traditional Japanese gravestone, which is tall and thin. Some people consider this to be a bearish sign while others argue that this is only sometimes the case. So, sometimes people will talk of a specific “bearish gravestone doji” which indicates prices are going to drop.
On the other hand, if the lines are on top, this is called a dragonfly doji. It’s considered the opposite of the gravestone doji, both in appearance and meaning. The top lines are said to resemble the head of a dragonfly, an otherwise slim and stick-like insect.
Another pattern is the hammer doji. Hammer dojis are relatively rare, so they are not mentioned very much. The pattern occurs when the price drops after opening but still closes at the opening price. As expected, their shape on the charts is vaguely hammer-like.
When the hammer pattern happens after a price rise, it is called the “hanging man” because of the way the drop looks on the charts.
When the high, low, open, and close prices are equal, a “four-price doji” is formed.
There are also a couple of doji patterns named after stars. The first is known as the “morning doji star.” These morning star patterns appear after bearish periods. The opposite of the morning doji star is the evening doji star. It’s a pattern that shows up when prices have been going up. Neither of these should be confused with the “shooting star” pattern which is a candlestick pattern, but not a doji.
Ever since Honma’s invention made its way to the West, people have been adapting the terms and creating new ones. So, don’t be surprised if new doji candlestick patterns are named in the future!


